Contents
EJERCICIO 1
% A)
type factr
% B)
type combina
% C)
type bernstein
%D)

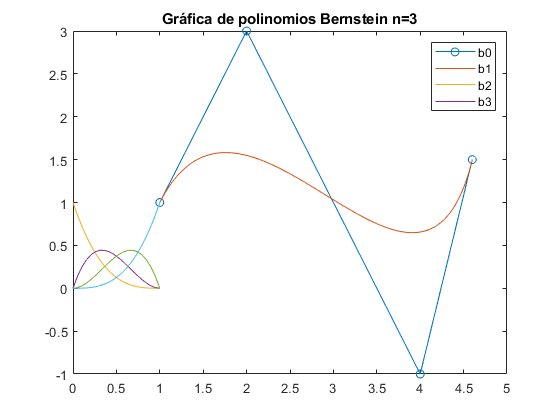
t=linspace(0,1);
V=[1 2 4 4.6;1 3 -1 1.5];
plot(V(1,:),V(2,:),'-o');
n=size(V);
n=n(2);
s=size(t);
x=zeros(n,s(2));
y=zeros(n,s(2));
for i=1:n
    x(i,:)=bernstein(n-1,i-1,t)*V(1,i);
    y(i,:)=bernstein(n-1,i-1,t)*V(2,i);
end
a=sum(x);
b=sum(y);
hold on;
plot(a,b);

%GRÁFICA

t=linspace(0,1,20);
n=3;
for i=0:n
    b=bernstein(n,i,t);
    plot(t,b);
    hold on;
end
legend('b0','b1','b2','b3')
title('Gráfica de polinomios Bernstein n=3')
function f=factr(n)
    if n==0
        f=1;
    else
        f=n*factr(n-1);
    end
end

function c=combina(n,i)
c=factr(n)/(factr(i)*factr(n-i));
end

function b=bernstein(n,i,t)
    b=combina(n,i).*(t.^i) .*(1-t).^(n-i);
end

EJERCICIO 2
%A)
[Y]=xlsread('sotaventogaliciaanual.xlsx','B:B');
hist(Y)
title('Histograma de frecuencias')

%B)
Y=xlsread('sotaventogaliciaanual.xlsx','B:B');
x=0.5:1:max(Y);
viento=hist(Y,x);
frec=viento/sum(viento);
f=@(a,x) (a(1)/a(2))*((x/a(2)).^(a(1)-1)).*exp(-(x/a(2)).^a(1));
k=std(Y);
c=mean(Y);
a0=[k c]; %valor inicial
af=nlinfit(x,frec,f,a0)
hold on

%DIAGRAMA FRECUENCIAS
bar(x,frec,'c');

%FUNCIÓN DE WEIBULL
x=linspace(0,max(Y),100);
y=f(af,x);
plot(x,y,'r')
title('Ajuste a la función Weibull')
xlabel('Velocidad')
ylabel('Frecuencia')
hold off

%C)
X=xlsread('sotavento_curva potencia.xlsx','A:A');
Y=xlsread('sotavento_curva potencia.xlsx','B:B');
title('Curva de potencia interpolada')
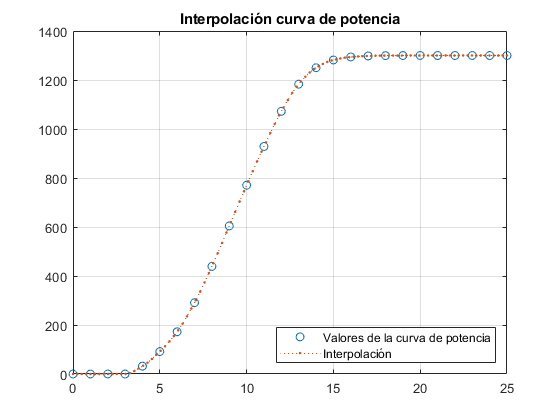
xq=linspace(0,25);
vq1=interp1(X,Y,xq,'pchip');
plot(X,Y,'o',xq,vq1,':.');
title('Interpolación curva de potencia');
legend('Valores de la curva de potencia','Interpolación','Location','southeast');
grid on
af =

    2.3849    6.0208

EJERCICIO 3
El movimiento de un sistema masa-resorte-amortiguador se describe por la ecuación diferencial: mD2x(t)+cDx(t)+kx
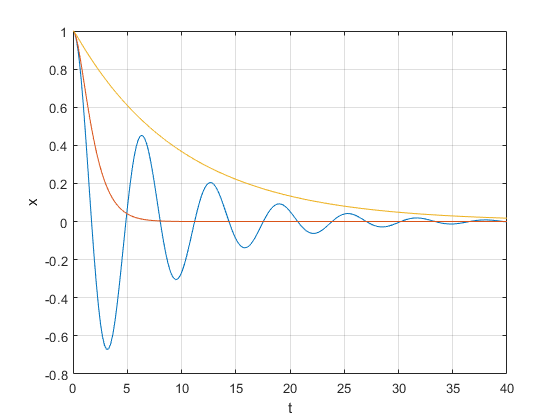
m=20;k=20;
c=5;c1=40;c2=200;
x0=[1,0];
tf=40;
f=@(t,x) [x(2);-c*x(2)/m-k*x(1)/m];
[t,x]=ode45(f,[0,tf],x0);
plot(t,x(:,1))
grid on
xlabel('t')
ylabel('x')
hold on
f1=@(t,x) [x(2);-c1*x(2)/m-k*x(1)/m];
[t,x]=ode45(f1,[0,tf],x0);
plot(t,x(:,1))
f2=@(t,x) [x(2);-c2*x(2)/m-k*x(1)/m];
[t,x]=ode45(f2,[0,tf],x0);
plot(t,x(:,1))
